Productivity
Build the bikes Power BI report
- Category
- Productivity
- Platform
- Windows
- Length
- 29 min
- Resolution
- 1920 × 1200
- Software
- Power BI Desktop
29min
826clicks
11keys
Power BI Desktop · Windows
00:00 / 29:24
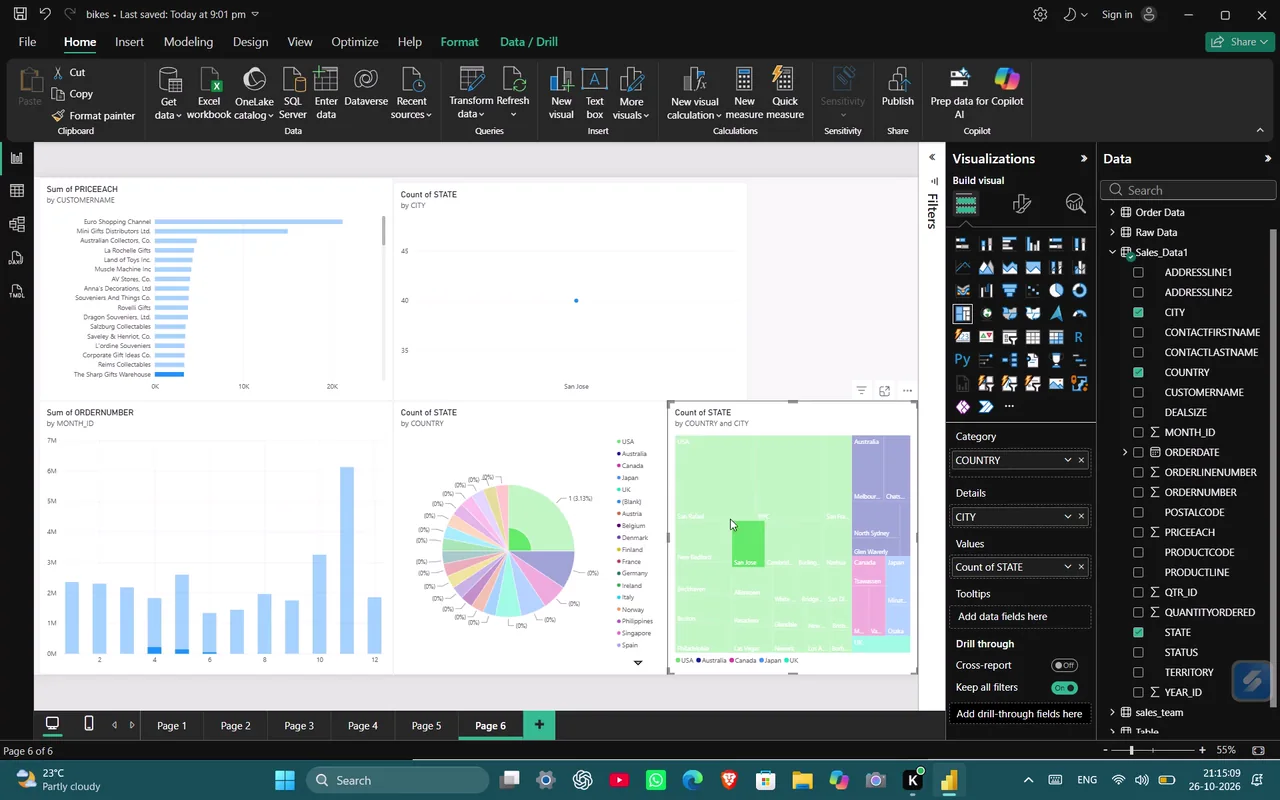
Build and format the bikes report using its sales and employee data.
Created and extensively customized a multi-visual Power BI report from the bikes dataset, configuring charts, cards, a treemap, and a pie chart to explore sales and geographic data through cross-filtering. Applied detailed visual formatting, including colors, labels, axes, backgrounds, borders, and effects.